The infographics with drawings, diagrams, and charts serve to explain processes and present all kinds of information. We started them by looking long ago in the newspapers, but nowadays they are everywhere. In social networks or website content, they always attract attention and stand out.
Why not use them for our practical work? Why not take advantage of them to make a presentation and use them as support material? The big problem with infographics is that it takes a little bit of graphic design knowledge to create them. That’s true. However, with the DesignCap Infographic Maker, this will no longer be a problem.
Take a look at DesignCap
DesignCap is a tool with powerful functionalities to generate free infographics in a few clicks, and you can share them with your partners and readers online. DesignCap offers an intuitive interface for almost all users, even for amateurs, to create compelling infographics in a few minutes. It relies on a tool palette that combines drag-and-drop, text editing, and quick icon insert functionality to enrich your infographic and facilitate storytelling.
In addition to the millions of free stock photos, DesignCap offers millions of icons, hundreds of preset fonts, a wide selection of shapes (arrows, circles, etc.), dozens of chart types (map, column, pie, and others), list modules to be divided into different categories, etc. Besides, the whole process can be realized by a few mouse clicks. Choose a particular tool to get the result you want.
Once the infographic is created, it can easily be shared from the tool’s management.
Create infographics with DesignCap
Open the DesignCap website and create an account. Then we can already select a template from many of the free templates out there.
Once we have selected the desired infographic template, we go to the graphic editor to make some changes. Don’t be panic. Here you don’t have to know Illustrator, Photoshop, or Corel Draw to be able to use DesignCap. It is as simple as selecting elements, editing, and dragging them.
The key to using DesignCap is to visualize the infographic that we want to create and decide on a theme. Then, pick the template that most closely resembles what we have in mind. Then, when going to the editor, what you should try is always to keep the original design guidelines, so that our infographic continues to look professional after we edit it. Obviously, the less we change the style, the easier it will be to fit better. Replace the elements in the template, keeping its style.
I won’t do an in-depth analysis of the DesignCap editing tool since they are very intuitive and user-friendly. You can add images, shapes, charts, icons, change the font style, and much more.
DesignCap is free, but if you pay a premium account, you will have additional options. You can look at its pricing page to know the details: https://www.designcap.com/pricing.html.
What else can DesignCap do?
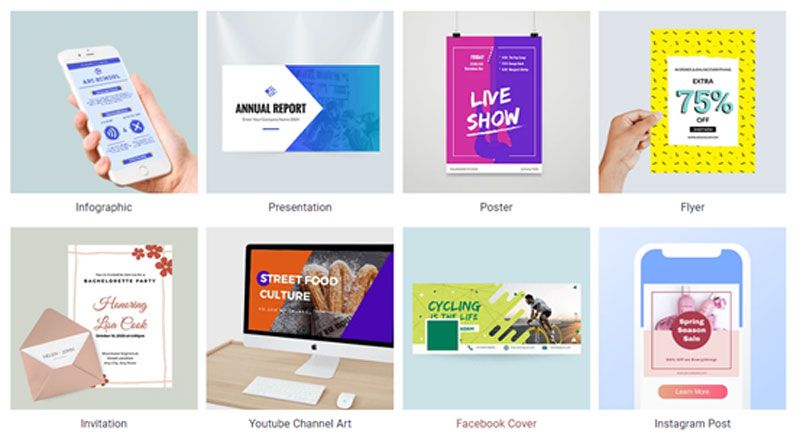
Besides the professional infographics in DesignCap, it offers the ability to create presentations, reports, cards, Facebook covers, YouTube channel arts, logos, YouTube thumbnails, Instagram posts, Tumblr banners, Twitter headers, Pinterest graphics, etc. So whether you are a teacher or a businessman, whether you are a blogger or social page admin, whether you are a webmaster or a store owner, you can use DesignCap to make graphics to meet your needs.
Conclusion
Online infographic creation services are widely used today. “Data visualization” is currently the new work of online publishers. If you are interested in creating high-quality and professional-level infographics that make a difference, you will inevitably be involved in the DesignCap, needing no tech or design skills.

Namaste UI collaborates closely with clients to develop tailored guest posting strategies that align with their unique goals and target audiences. Their commitment to delivering high-quality, niche-specific content ensures that each guest post not only meets but exceeds the expectations of both clients and the hosting platforms. Connect with us on social media for the latest updates on guest posting trends, outreach strategies, and digital marketing tips. For any types of guest posting services, contact us on info[at]namasteui.com.

